In October 2012 the Meteorological Office’s Hadley Center in
England, one of a handful of research centers that maintain global temperature
databases, released the HADCRUT4 data set, which shows no net global
temperature change since 1997. This is
in stark contrast to the clear temperature rise from 1968 to 1998, a change of
+0.7 oC in 20 years, for a warming rate of 0.035 oC per
year. The HADCRUT4 data can be seen at http://www.metoffice.gov.uk/hadobs/hadcrut4/figures/Figure7.png
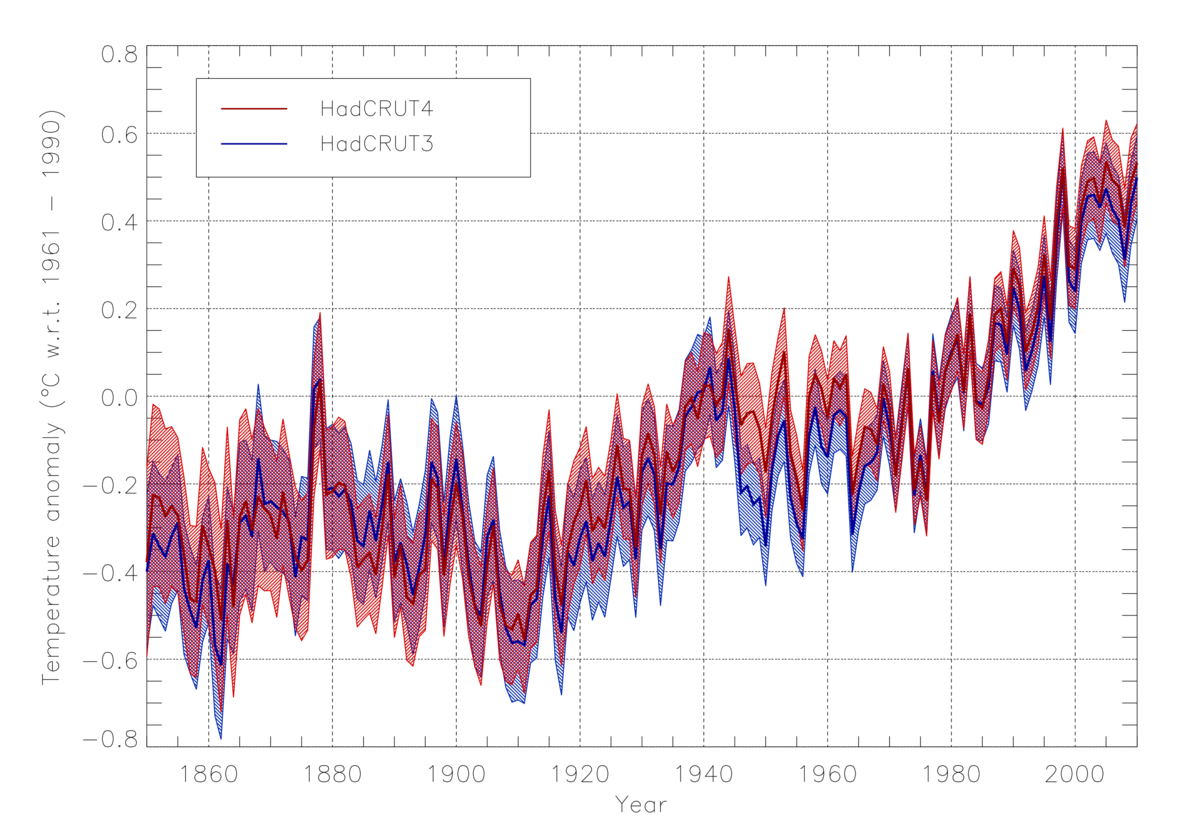
The Met Office followed up this disclosure with a projection
of future warming trends (issued, strangely enough, during the Christmas
holidays, and consequently largely missed by the press). In it they predict what they call a
“continuation of global warming” over the next five years, reaching a
“temperature anomaly” of 0.55 oC by the year 2017. This phrase means
that the temperature increase in 2017 relative to the average base reference
temperature for the years 1961-1990 will be 0.55 oC. Somehow they neglected to mention that
the actual observed temperature anomaly has hovered around the +0.5 oC
level since 1998: in other words, it will not be significantly warmer in 2017
than it is now. From 1997 to 2017,
according to the Hadley Center’s best estimates, we will have had 20 years
without any global warming.
Last week Jim Hansen, a prominent climate modeler at NASA’s
Goddard Institute of Space Studies (GISS) in New York City, concurred with the
Hadley Center’s historical data. Dr.
Hansen was one of the earliest and most vocal proponents of the idea that human
activities, especially burning of fossil fuels, are responsible for global
warming. GISS also finds that the
“five-year running average” of global temperatures, spanning 14 years of data,
has not changed in the past decade. This
standstill in warming, which was not predicted by any of the climate models, reminds
us of the primacy of data over both enormously complex (but still
oversimplified) computer models and faith-based beliefs. It also presents a fresh challenge to climate
modelers.
Then, two days ago, Dr. Terje Berntsen, a professor at the
University of Oslo’s Department of Geosciences and a senior research fellow at
the Center for International Climate and Environmental Research in Oslo,
released a reassessment of the warming effects of carbon dioxide. His research, incorporating the data showing
the last decade and a half of no net global warming, revealed that the “climate
sensitivity” for carbon dioxide is about 1.9 oC per doubling of CO2,
far below the numbers often quoted in the media.
“Earth’s mean
temperature rose sharply during the 1990s. This may have caused us to
overestimate climate sensitivity,” Prof. Berntsen explains. “We were most likely witnessing natural
fluctuations in the climate system – changes that can occur over several
decades – and which are coming on top of a long-term warming.” Also recall that Prof. Ramanathan’s data
suggest that soot has two thirds as large a warming effect as CO2
does, so that 40% of the total warming should actually be attributed to soot. Then the climate sensitivity is only about
1.2 oC per doubling of CO2. Of course, the present temperature plateau
was not predicted by our models. Predicting the future effects of soot is hard
because controlling soot production is relatively easy compared to controlling
carbon dioxide release. Future soot
emissions from diesel engines and coal-fired power plants will reflect legal
and regulatory rules that do not yet exist, and which therefore defy
prediction.
We are reminded of the immortal words of that great
philosopher, Yogi Berra: “The trouble with predicting the future is that it is
very hard.”
1 comment:
Thanks, John, for both your thoughtful article and this forum in which to respond. IPCC tends to be pretty conservative in its assessments, and thus far black carbon (soot) hasn't got the respect it deserves. In IPCC's Fourth Assessment Report (2007, their latest) they estimate the radiative forcing from soot on snow to be 0.1 W/m^2 compared to 1.6 W/m^2 for CO2, or about 6%. (See AR4 WG1 Fig SPM.2. But that assessment is now five or six years old: as you observe, recent estimates are far, far higher, and it will be interesting to see what IPCC comes up with next. Some recent (summer 2010) popular links are Soot Ranks Second After CO2 in Arctic Ice Melt Warming Contribution and Sulfates plus black carbon a nasty combo for warming.
Anymore it takes a fair bit of courage to start a global temperature time-series comparison but fourteen years ago, and extract its reflection upon climate. The problem neatly skirted by the present authors is that 1998 coincides with the latter half of the most powerful (by Multivariate ENSO Index) El Nino event of the 20th century. Although there can be extended periods with little or no activity, ENSO seems at best a quasi-periodic phenomenon with 4-to-6 year cycles: IPCC climatologists take a generally conservative tack and tend to favour ten-year binomial average in this application, taking the resulting hit of larger error bars near the endpoints e.g. today.
Which doesn't mean others aren't free to speculate about the effects transient natural phenomena such as ENSO, volcanism, and (to a much lesser degree) solar fluctuations might have on observed short-term temperature trends, and to what extent short-term ocean surface temperature fluctuations might be averaged out at depth. Some recent attempts are documented at Human activity continues to warm the planet over the past 16 years.
Post a Comment